Reading Time: 6 minutes
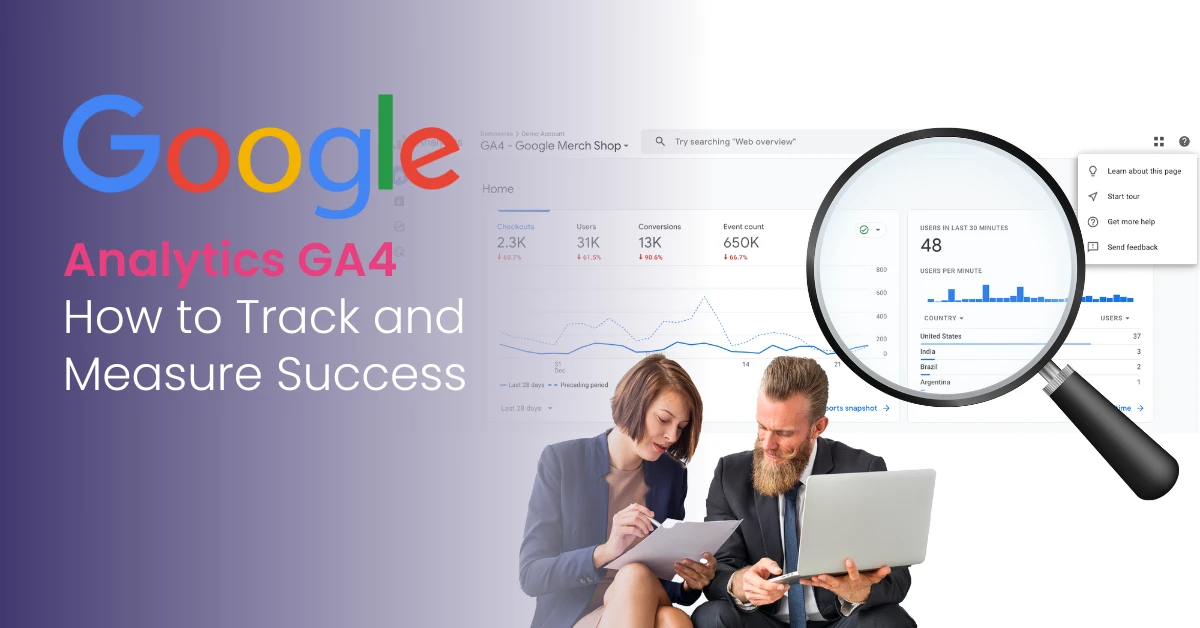
Table of Contents
Introduction to Google Analytics
Google Analytics is a strong tool. It tracks website traffic and user behavior. It gives useful insights into marketing efforts and conversion events. Knowing Google Analytics 4 (GA4) is key for good user engagement and conversion tracking. GA4 uses an event-based model. This model collects data with great accuracy. It helps businesses improve marketing strategies and user experience. GA4 metrics are numbers that show website or app performance. They give businesses useful information to act on.
GA4 supports custom events and enhanced measurement. This helps product and UX teams make data-driven choices. Setting clear business goals and KPIs before using GA4 is important. This step helps match analytics with business aims. It makes sure the data collected is useful and relevant.
Setting Up Google Analytics 4
- To set up GA4, first make a Google Analytics account. Then add the tracking code on your website or app. You can do this by hand or use platforms like WordPress or Shopify.
- Use Google Tag Manager to manage tracking codes easily.
- Set up data streams to gather web and app data.
- Create custom events with names and details to track user actions.
- Turn on Enhanced Measurement to auto-track actions without extra coding.
- Learn GA4’s event-based model and how it differs from Universal Analytics.
- Check and manage existing events to track key actions.
- Pick a property name that matches your main website.
Track user acquisition to see where traffic comes from. Sessions in GA4 cover all actions during a visit. This gives a full view of user actions in one session. This helps businesses study user behavior and improve strategies for better engagement.
GA4 Interface and Navigation
1. GA4 Interface Overview
The GA4 interface shows key metrics like active users, engaged sessions, and conversion events. It gives a quick look at website or app performance. You can customize reports to focus on the metrics that fit your business. This helps you watch user interactions better.
2. Navigating GA4
The main menu has Reports, Explore, Advertising, and Admin. Reports show traffic acquisition, user engagement, and conversion metrics. Explore lets you make custom reports for deeper insights. Advertising focuses on marketing efforts that lead to conversions. Admin controls account settings and data collection. Use segments and comparisons in Exploration to study user groups and behaviors. GA4’s Analysis Hub helps with custom data analysis and event reporting.
3. Customizing Dashboards and Reports
GA4 lets you build custom dashboards and reports. You can focus on key metrics and conversion data. Pre-made reports and templates help study web analytics data.
4. Data Visualization and Segmentation
GA4 offers charts and graphs to find trends in user activity. Filters and segments let you look at specific data groups. For example, users from certain campaigns or conversion events. To measure ROI, GA4 lets you assign money values to conversions. This shows how well campaigns work. Also, pageviews in GA4 now include web pages and screen views. This gives a fuller view than Universal Analytics.
5. Summary of GA4 Interface Benefits
GA4 helps collect, analyze, and report data well. It lets you make smart choices from real-time info on user behavior and marketing results.
Understanding User Behavior
GA4 tracks user behavior like clicks, scrolls, and video plays. This helps find weak spots and improve marketing. Key metrics are active users, average engagement time, and event count. ‘Active Users’ counts users active for more than 10 seconds. This is GA4’s main metric for user activity.
Total Users counts all visitors but is not the main metric. ‘New Users’ counts first-time visitors in a time frame. Tools like user lifetime and cohort analysis show behavior over time. ‘Total Users’ shows the total number of visitors, giving a broad audience size.
Measuring User Engagement
User engagement is measured by engaged sessions, average engagement time, and event count.
Engagement Rate = engaged sessions ÷ total sessions.
Track actions like form submissions to see engagement. Engaged sessions last over 10 seconds or have many pageviews.
GA4 defines ‘Bounce Rate’ as the percent of sessions not engaged. Use engagement metrics to improve marketing. Features like enhanced measurement and Google Signals boost accuracy. Tracking conversions shows which actions help business. Engagement Rate shows user interest. But watch out for common GA4 issues like data errors and wrong event settings. These need careful setup and checks.

Tracking Events and Conversions
Events track user actions like form fills or button clicks. Track key events like purchases and free trial sign ups to measure success. GA4 auto-tracks over 30 events. Some can be set as conversions. Mark key events as conversions to focus on important actions. Conversion tracking shows when users do valuable things. Conversion tracking needs technical setup and can have errors.
Event details and names capture info like form type or lead value. Event Count shows how many times events happen. Custom metrics measure unique data for lead goals. Setting up conversion tracking needs care.
Optimizing Landing Pages
Use GA4 to improve landing pages by tracking user behavior and engagement. Sessions per user show engagement and visit frequency. High sessions per user mean returning, engaged visitors. Consumers’ average sessions per user reveal engagement and visit habits. GA4’s data display shows landing page metrics to help optimize.
Understanding User Lifetime
User lifetime metrics show how users behave over time. Lifetime Value (LTV) measures total customer worth. Average Revenue Per User (ARPU) divides total revenue by users. Total Revenue shows all sales income from transactions or subscriptions. Cohort analysis and user metrics track lifetime and campaign success. Historical data shows behavior changes.
Using Google Analytics for SEO
Track SEO metrics like search queries and keyword ranks. Link GA4 with Google Search Console for deeper SEO info. Study search queries and keywords to improve SEO. Use UTM parameters for exact campaign tracking.
Link Google Ads to share conversion data and track offline or call conversions with imported data. Make custom reports on keywords, landing pages, or traffic sources. Track user behavior and engagement to understand site use.

GA4 and Google Ads
Connect Google Ads with GA4 to import conversion data. See how ads drive key events like purchases and form fills. Link conversions to ads, keywords, and campaigns to find what works best. Check conversion rate, cost per conversion, and ROAS to improve bids and budgets. Track cross-channel conversions with GA4 and Google Ads for a full marketing view.
Watch ad campaign results, user actions, and landing page conversions. Track click-through rates and cost per click for full ad insights. Check conversion metrics often to boost campaigns.
Best Practices for Google Analytics 4
Set up data streams and custom events. Filter out internal traffic and bad referrals. Use Google Tag Manager for tracking codes.
Know GA4 vs. Universal Analytics differences. Turn on Enhanced Measurement and Google Signals. Use DebugView to check event tracking. Enable predictive metrics to forecast behavior. Set data retention to 14 months.
Troubleshooting and Limitations
GA4 may sample data in big datasets, which can lower accuracy. Follow data laws like GDPR; manage user consent well.
Use DebugView to check tracking live. Check tracking code and data stream setup. Check consent management for compliance. Use third-party tools or exports if needed. After making a GA4 property, see real-time data to confirm setup works. This ensures data is right from the start.
Grow your business with Varun Digital’s expert GA4 setup and marketing insights.
Frequently Asked Questions (FAQs)
1. What is Google Analytics 4 (GA4) and how is it different from Universal Analytics?
GA4 uses an event-based model to track user actions on websites and apps. Universal Analytics used session-based tracking. GA4 offers better cross-device tracking and detailed engagement metrics.
2. How do I set up Google Analytics 4 on my website?
Make a Google Analytics account, add a web data stream, and install GA4 tracking code by hand or with Google Tag Manager. Name events and set details to track conversions and actions.
3. What are key metrics to track in GA4 for measuring success?
Track active users, engaged sessions, average engagement time, event count, conversions, and user lifetime. Make custom metrics for your business goals.
4. How can I track conversions and events in GA4?
Use automatic, recommended, or custom events. Mark key events as conversions to track important actions like form fills and purchases.
5. Can GA4 track users across multiple devices?
Yes, GA4 supports cross-device tracking with anonymous User IDs.
6. How do I create custom reports in GA4?
Use the Explore section to mix dimensions and metrics for custom insights.
7. What is an event value and how is it used in GA4?
Event value shows how important or valuable an event is. It helps measure revenue and ROI.
8. How can I use GA4 data to improve my marketing strategies?
Look at acquisition, engagement, conversion, and traffic metrics to improve campaigns and ROI.
9. Are there third party tools that integrate with GA4?
Yes, such as Google Ads, Google Search Console, and other marketing platforms.
10. What practical tips can help me get the most out of GA4?
Set up data streams right, use Google Tag Manager, define key events and conversions, check metrics often, and make custom reports to watch results well.
Published: October 30th, 2025